Innovative Carbon Tracking Solutions

We utilize advanced methodologies to integrate diverse data streams, ensuring accurate carbon emissions tracking and compliance with evolving regulations for a sustainable future.

A computer screen displaying an analytics dashboard with metrics such as event activity, showing a current value of 4.7k for today's activity. There are graphs indicating trends and peaks in the data, as well as labels for different types of events.

Carbon Methodology

Integrating data streams for comprehensive carbon analysis and insights.
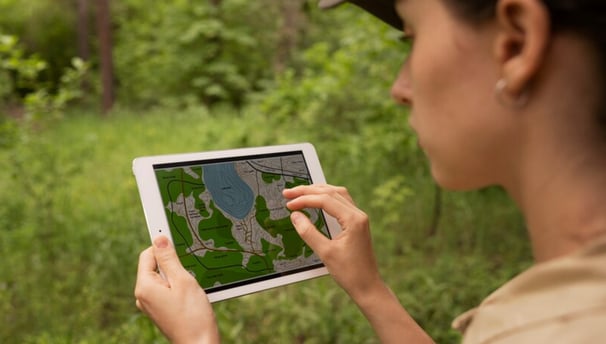
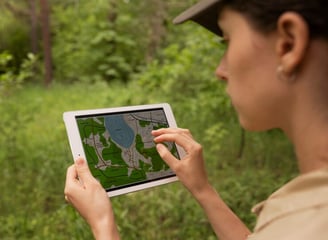
Emission Heatmaps

Dynamic mapping of emissions using advanced data integration techniques.
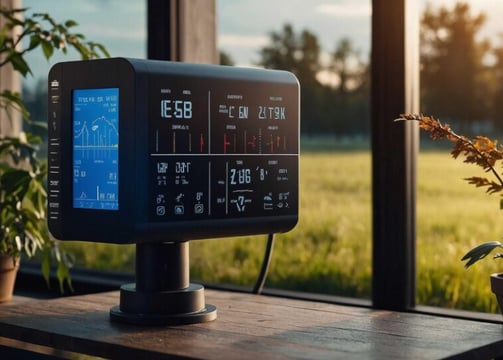
A person with a striped shirt and a cap is standing in front of a computer screen displaying data and analytics. Another laptop is open on a desk below the monitor, and a large metallic tank with a pressure gauge is nearby.
A person is holding a smartphone displaying an analytics or insights screen with various metrics and numbers. The individual is wearing a casual white shirt and a watch with a black band. The surrounding environment includes an indoor plant.
Data Integration

Combining diverse data sources for accurate carbon footprint assessment.

Carbon Emission Analysis

Innovative solutions for tracking and reducing carbon emissions across various industries and sectors.

Data Integration Process

Combining diverse data streams for comprehensive carbon impact assessment and reporting.

A laptop displaying a dashboard with various graphs, charts, and numeric data. The screen is partially visible, showcasing sections with line graphs, financial figures, and small images. The background is blurred with a prominent red light creating a warm ambiance.
Advanced Emission Modeling

Utilizing satellite imagery and supply chain data to create dynamic emission heatmaps for informed decision-making.